PowerBI, D3, zoom, oh my
Posted

Funny thing, PowerBI. The online service is powerful and works on all sorts of devices. PowerBI desktop? It’s from the same Microsoft dept as Visio: distinctly Windows only. Except, perhaps in a nod to real politik, you can build PowerBI custom visuals on a Mac. Go figure.
To be fair, the browser version keeps getting more and more powerful: you can already edit reports in the browser and Azure Data Factory demonstrates that (a version of) Power Query is possible online as well. One hopes that the long term plan is to kill the desktop in favor of a pure online, cross platform environment. One has been hoping for that with Visio for some time though.
Anyway, onto the subject of this post: which I freely admit is far to one end of the nerd spectrum. A PowerBI custom visual permits a developer to really render whatever they wish within an iFrame hosted in a PowerBI report. The visual has to be compatible with modern browsers, which means, typically, you’re rendering the visual in HTML or, my favorite, SVG.
While you can write the SVG from scratch, it’s tough going and the tutorial guides you towards the excellent D3 library. The visual API provides the bindings to the data from the PowerBI service, D3 gives you the bindings to the DOM.
Back in March I built a custom visual for a background project at work. None of the available visuals did what we wanted and it was a fun challenge. One thing I never got working was zoom and pan behavior. Despite my best efforts, every turn of the mouse wheel would result in a forlone console error
6VM101732:3571 Uncaught TypeError: Cannot read property 'transform' of undefined
  at SVGSVGElement.<anonymous> (<anonymous>:3571:49)
  at Dispatch.apply (<anonymous>:18193:18)
  at customEvent (<anonymous>:12450:21)
  at Gesture.emit (<anonymous>:21553:79)
  at Gesture.zoom (<anonymous>:21541:12)
  at SVGSVGElement.wheeled (<anonymous>:21581:7)
  at SVGSVGElement.<anonymous> (<anonymous>:12354:16)
Much Googling demonstrated I wasn’t the only one struggling to make this work. Not being an expert in either Typescript or D3 I shipped what I had and moved on.
This week a lightbulb went off: one of the challenges with D3 is that it changes rapidly, sometimes in a breaking manner. Zoom behavior, in particular, has changed quite a lot. This means there’s a lot of old code out there to Google. It turned out that upgrading to the latest D3 version was the solution.
To do this required messing with the default NPM package.json that the pbiviz tool gives you. Here’s my resulting package definition:
{
  "name": "visual",
  "scripts": {
    "pbiviz": "pbiviz",
    "start": "pbiviz start",
    "package": "pbiviz package",
    "lint": "tslint -c tslint.json -p tsconfig.json"
  },
  "dependencies": {
    "@babel/runtime": "7.15.4",
    "regenerator-runtime": "0.13.9",
    "@types/d3": "7.0.0",
    "core-js": "3.17.2",
    "d3": "7.0.1",
    "powerbi-visuals-api": "~2.6.1",
    "powerbi-visuals-utils-dataviewutils": "2.2.1"
  },
  "devDependencies": {
    "@types/core-js": "^2.5.5",
    "ts-loader": "6.1.0",
    "tslint": "^5.18.0",
    "tslint-microsoft-contrib": "^6.2.0",
    "typescript": "3.6.3"
  }
}
Run npm install to ensure you have everything and note that to compile I also had to make changes babel, core js and regenerator versions.
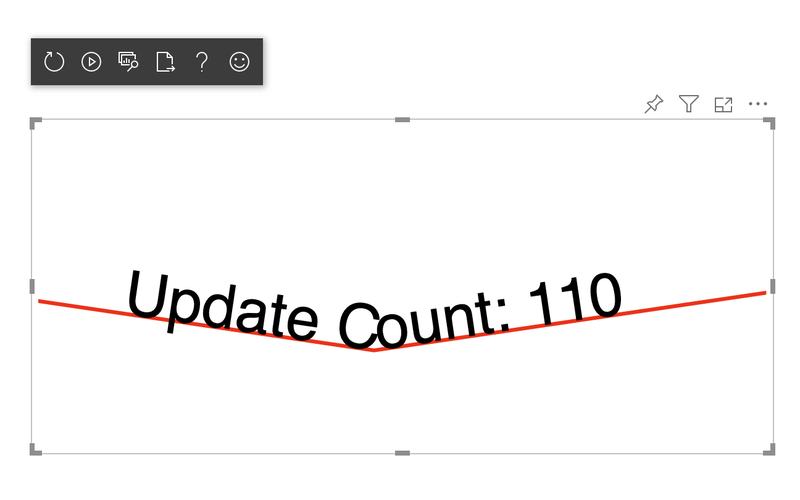
Once D3 was upgraded, the standard zoom behavior worked. Here’s an example visual which replaces the HTML update count sample with an SVG version (rendering the image above). The zoom behavior is lines 51-58.
|
|
Want to try yourself? Follow the circle card tutorial, replace the package.json and visual.ts files with the ones here and it should work.
Good luck!