What's with a knowledge graph?
Posted · 4 min read · 819 words
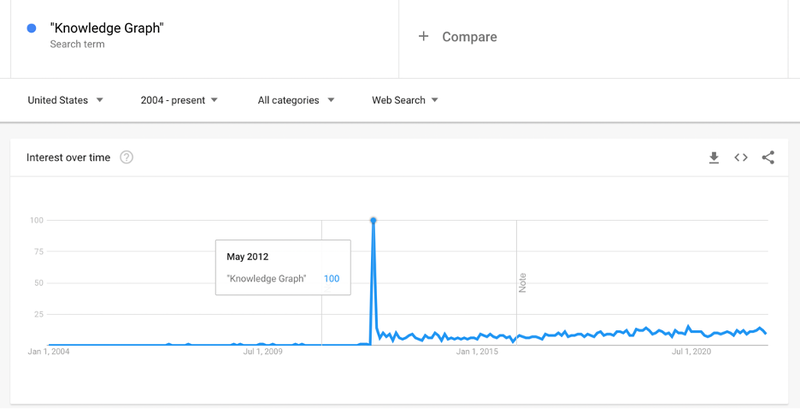
The phrase Knowledge Graph has been gradually increasing in use ever since Google popularized the term to describe their repository of structured knowledge back in May 2012. I still encounter a lot of confusion about what a Knowledge Graph is and why they are worth investing in.
In my view, Knowledge Graphs play a critical role in connecting data. To start, let’s consider what a graph is and why it differs from traditional forms of data representation and storage. In my mind, there are two fundamental differences, grounded in the idea that a graph should be able to store anything we want without pre-existing configuration.
For the rest of this post, let’s discuss the shape of data: Consider how we normally structure data, in tables, as the Google Trends data above:
| Month | “Knowledge Graph”: (United States) |
|---|---|
| 2012-05 | 100 |
| 2012-06 | 14 |
| 2012-07 | 6 |
| 2012-08 | 10 |
| 2012-09 | 7 |
| 2012-10 | 9 |
| 2012-11 | 4 |
| 2012-12 | 10 |
The data has two columns, month and “Knowledge Graph”: (United States) which, looking at the trends we learn is the interest – out of 100 – for that month.
We can easily add other data points by adding additional columns (notice the values rebase to accommodate the far greater interest in Data Science as a search term)
| Month | “Knowledge Graph”: (United States) | “Data Science”: (United States) |
|---|---|---|
| 2012-04 | <1 | 9 |
| 2012-05 | 13 | 8 |
| 2012-06 | 2 | 6 |
| 2012-07 | 1 | 5 |
| 2012-08 | 2 | 10 |
| 2012-09 | 1 | 16 |
| 2012-10 | 2 | 12 |
Representing data in tables such as these works well for human interpretation, but has some implications:
- There is a row level connection between data points: in this example, each row is a month of data for two different facts: search interest for two different terms.
- If we don’t have the data for a particular month, we must leave the cell blank, potentially making our table increasingly sparse as it widens.
- A new table is required to represent the data that is structured by something other than month.
- There is an implicit sort order in the table (by month). The wider and longer a table gets the more likely we will need to access by something other than month, requiring us to either scan the whole table or define and manage a secondary index on the table to speed up access.
- Software must be built to accommodate tables of any width (or force a hard limit on width). This complicates design and implementation.
These limitations mean that it is not possible for table-based systems (the pre-eminent data storage model of today) to store arbitrary data without some degree of design ahead of storage to create a schema of collaborating tables. In a relational database this is strictly enforced (the data must fit the schema). In big data systems such as Hadoop the table is defined as data is stored and then relationships between them managed at query time.
If ever wider tables are not a workable answer, what is?
Well, what if the tables are only ever three columns, guaranteed? Can we model and store any arbitrary data in that form? It turns out we can, and that’s the underlying storage model for a knowledge graph: one fact per row. The three columns are:
- Subject – the thing we want to talk about
- Predicate – the attribute of the thing
- Object – the fact
Considering the month of May & June 2012, above, we might represent the search interest for the two topics in the following way:
| Subject | Predicate | Object |
|---|---|---|
| Search_Interest_2012_05 | KG_Count | 13 |
| Search_Interest_2012_05 | DS_Count | 8 |
| Search_Interest_2012_06 | KG_Count | 2 |
| Search_Interest_2012_06 | DS_Count | 6 |
A first glance this might seem like a very repetitive way of storing & representing data. That’s correct. But consider the benefits:
- Since the system knows that the data will only ever have three columns it can be optimized for storage and retrieval of the data. (Compression techniques can be used to remove a lot of that repetition in storage).
- A single row is meaningful. It contains a single fact, and since we know that there will only ever be three columns, we don’t need the header to interpret the row.
- There are no blank cells (sparse tables). If we don’t have the fact, we don’t have the row.
- We can state anything about anything using this model. It might seem repetitive, but it’s possible. For example: some facts about an oil well, alongside a price for Dated Brent
| Subject | Predicate | Object |
|---|---|---|
| UWI 100 14 36 085 17 W6 00 | Depth | 1300’ |
| UWI 100 14 36 085 17 W6 00 | Latitude | 44.32423 |
| UWI 100 14 36 085 17 W6 00 | Longitude | -51.23143 |
| PCAAS000_2022_06_07_13:48:41 | Price | $115.795 |
These three columns of subject, predicate and object are how a knowledge graph can store any data without pre-configuration. The three values are also the underpinning of the RDF standard for data, which deals with how to make any row globally unique. That will be the subject of the next post in this series.